How accurate is ADS CFD? Checked against NASA reference solutions and wind-tunnel data
We compared the fully turbulent CFD mode of Aero Design Studio with three NASA reference codes and with seven airfoils measured in wind tunnels. Here is where it agrees, where it does not, and why. The full technical note, ADS-TN-01, is attached.
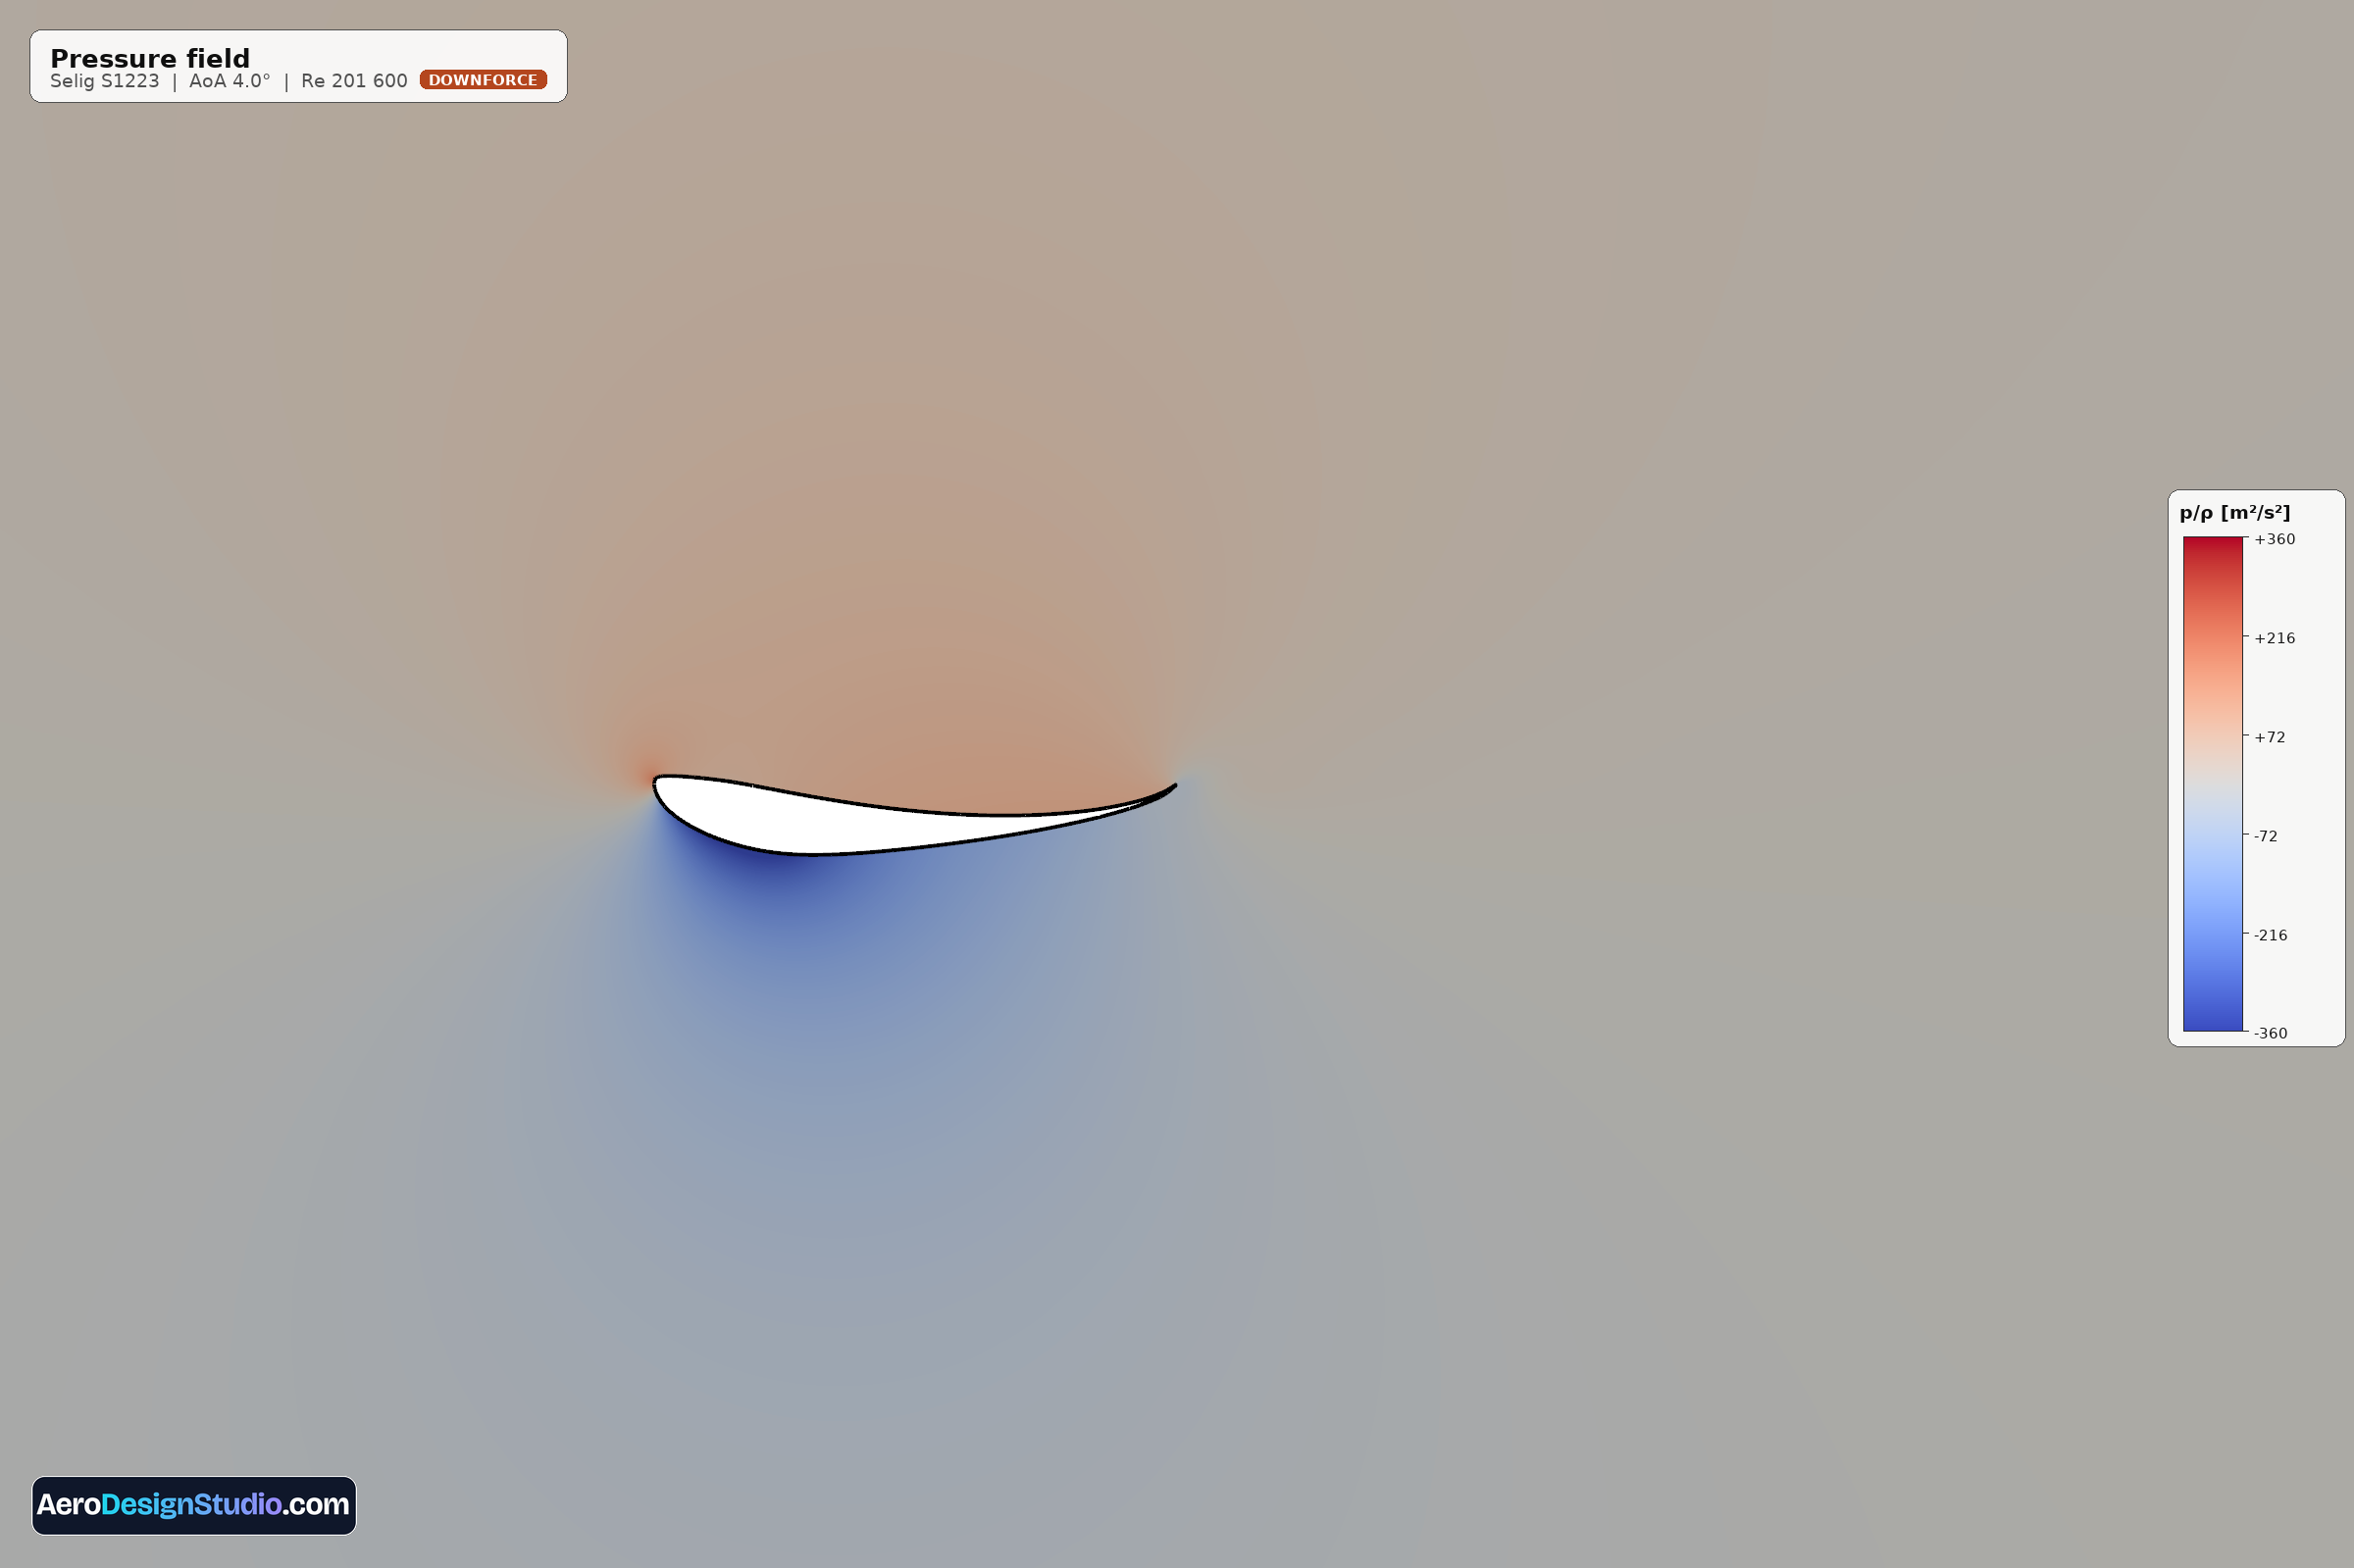
A CFD result is easy to produce and hard to trust. Before you rely on the numbers from our CFD tool, two questions need an answer. Does the tool solve its equations correctly? And how close do those equations come to what a wind tunnel measures?
This post is the short version of our answer. The long version is the technical note ADS-TN-01, attached at the end, with every table, every figure and every source. We wrote down what agrees and what does not, because a number is only useful when you know how far to trust it.
What we tested
The CFD tool has one mode open today: "RANS, fully turbulent". It solves the steady, incompressible Reynolds-averaged Navier-Stokes equations in OpenFOAM® with the k-omega SST turbulence model. In this mode the boundary layer is turbulent from the leading edge. That is the state behind a boundary-layer trip, and it is close to the state of a wing that works in the disturbed air around a car.
We asked two separate questions.
- Verification: does the tool return what other, independently written codes return for the same equations?
- Validation: how close is that solution to a wind-tunnel measurement?
For the first we used the reference cases of the NASA Turbulence Modeling Resource. For the second we compared seven airfoils with published wind-tunnel data, at Reynolds numbers from 200,000 to 6.3 million: S809, NACA 4412, Selig S1223, Eppler E423, NACA 2414, NASA GA(W)-1 and UI-1720.
First check: NASA reference codes
NASA publishes solutions for the NACA 0012 airfoil at a Reynolds number of 6 million from several independently written codes that use the same turbulence model. These solutions say what the equations give for this flow, with no experimental uncertainty involved. A code that solves the same equations has to return them.
Ours does. At 0 and 10 degrees the lift is within 0.1% of the mean of three reference codes (CFL3D, FUN3D and NTS) and the drag within 0.9%. At 15 degrees, close to the maximum lift of this case, the lift is 0.1% above their mean and the drag 1.3% below. For scale: the three reference codes differ among themselves by 0.7% in lift and 1.4% in drag at 10 degrees.
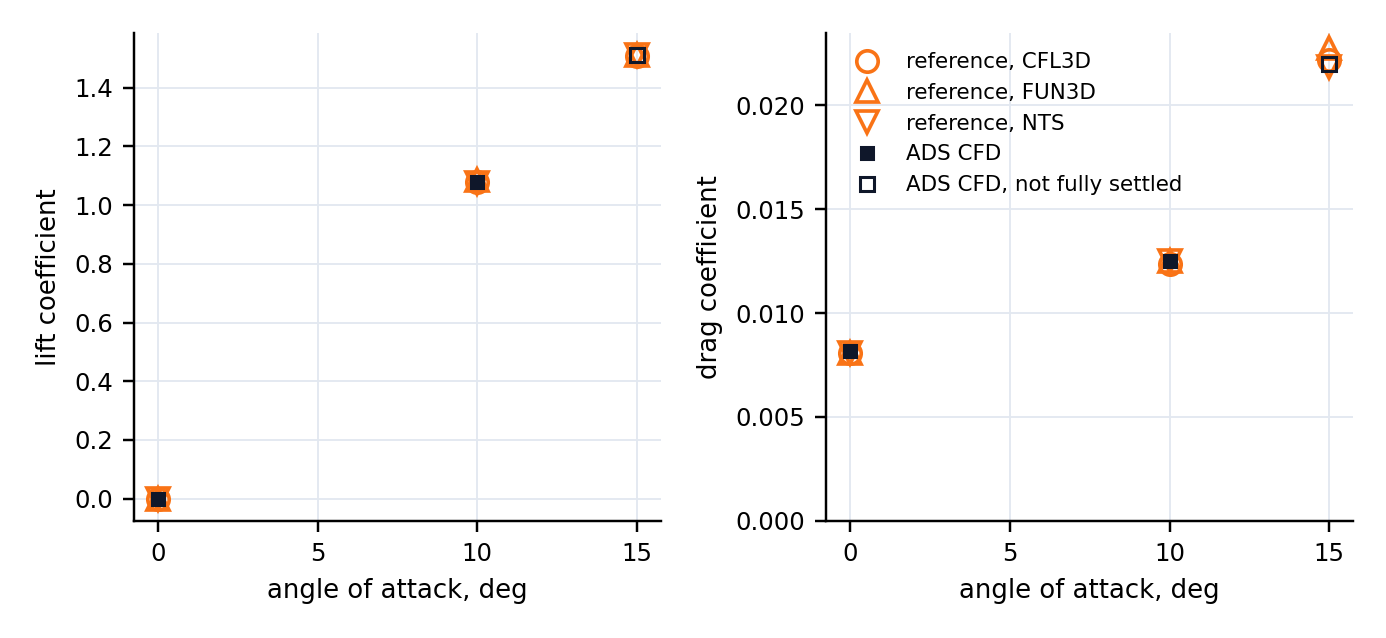
The second reference case is harder: the NACA 4412 at 13.87 degrees, with the flow separated over the rear of the upper surface. There our lift is 3.4% above that of two reference codes and our drag 3.8% below their mean. Separated flow is harder for every code, and this is the larger of the two differences we found.
Second check: the wind tunnel
A fully turbulent computation and a smooth model in a quiet wind tunnel are not the same flow. On the smooth model the boundary layer stays laminar over part of the chord, and a laminar boundary layer has less friction. The fairest test is therefore a model whose boundary layer was tripped near the leading edge.
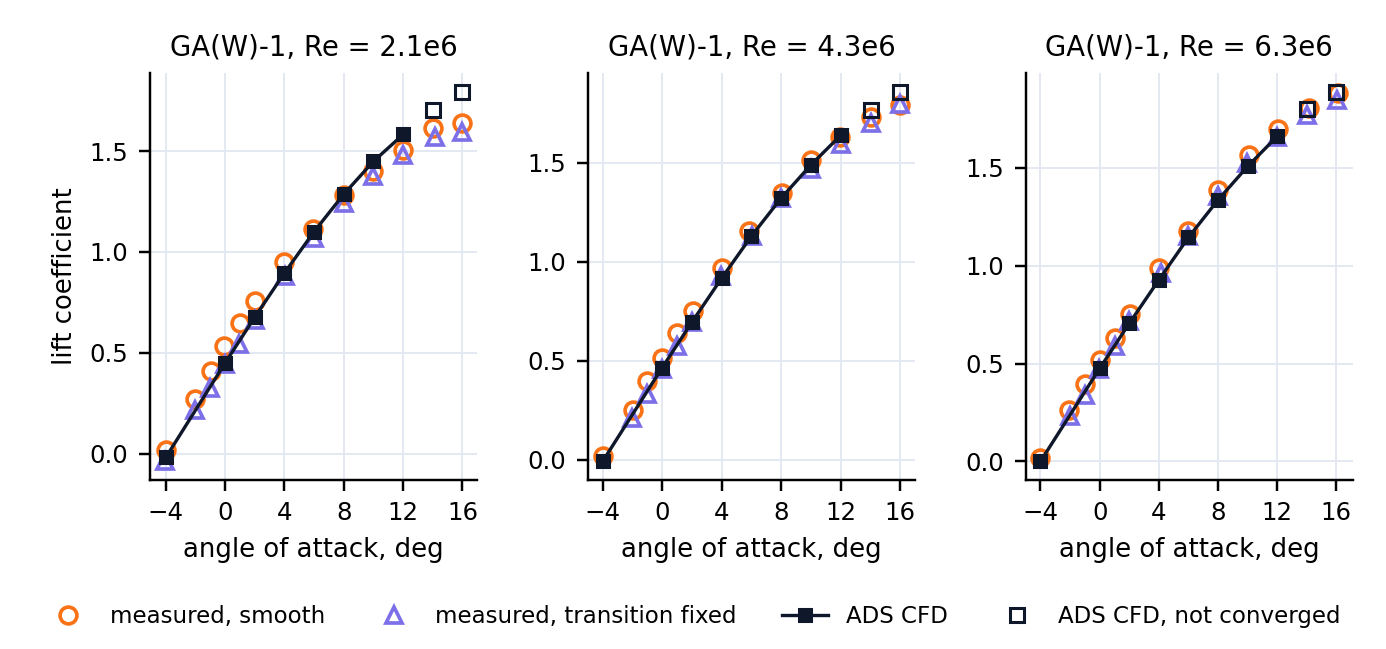
The NASA GA(W)-1 is such a case: a 17% thick section that reaches lift coefficients of 2, measured at Reynolds numbers of 2.1, 4.3 and 6.3 million with transition fixed at 8% of chord. Against it, the computed lift is within 4% of the measurement from 0 to 8 degrees at all three Reynolds numbers. The computed drag is lower than the measured one, by 9% on average. The trend with the Reynolds number is reproduced: from 2.1 to 6.3 million the drag at 0 degrees falls by 18% in the measurement and by 16% in the computation.
The numbers in one table
All values are for angles of attack from 0 to 8 degrees unless stated.
| Compared with | Lift | Drag |
|---|---|---|
| Three reference codes that solve the same equations (NACA 0012, Reynolds number 6 million, 0 to 15 degrees) | within 0.1% | within 1.4% |
| Wind-tunnel model with a tripped boundary layer (NASA GA(W)-1, Reynolds numbers 2.1 to 6.3 million) | within 4% | 0 to 17% below, 9% on average |
| Smooth wind-tunnel models, Reynolds numbers 2 to 6 million | within 8% (S809, NACA 4412); up to 16% below on the GA(W)-1 | 35 to 80% above in the low-drag range of the model, within 6% past it |
| Smooth wind-tunnel models, Reynolds number 200,000 | within 7% where the run converges | from the measured value (S1223) to 37% above it (NACA 2414) |
| Numerical uncertainty of a converged result, Reynolds number 2 million and above | 1 to 2% | 2 to 3% |
| Near and beyond maximum lift | indicative only | indicative only |
Where it does not agree, and why
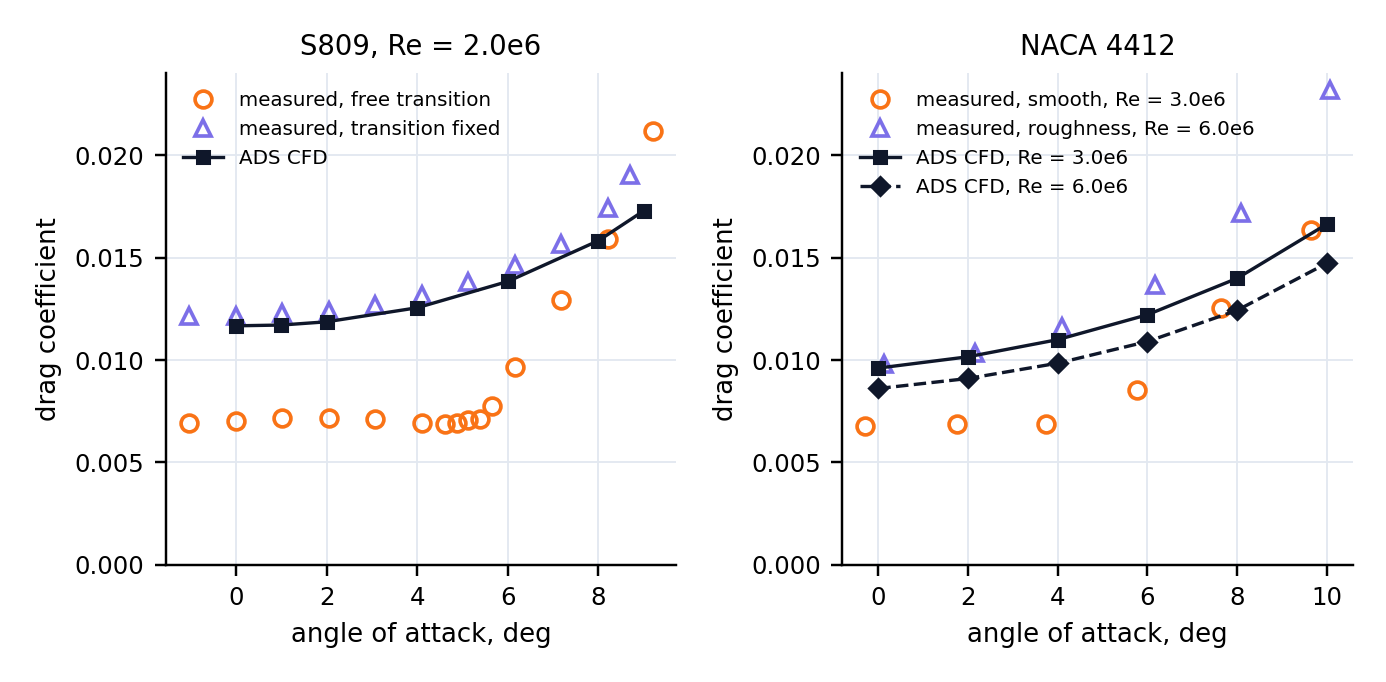
Drag against smooth models. The computed drag is that of a boundary layer which is turbulent from the leading edge. For a wing behind a trip, or in the disturbed air around a car, that is the right estimate. For a smooth wing in clean air it is an upper bound: where the wind-tunnel model carries a long run of laminar flow, the computed drag is up to 80% above the measured one. For the drag polar of such a wing, our XFOIL tool, which predicts transition, is the better choice.
Lift of smooth sections that are loaded at the rear. A section that carries much of its load at the rear has more lift on a smooth model than the computation gives it: up to 16% more on the GA(W)-1 at the lowest Reynolds number.
Near and beyond maximum lift. Values there are indicative only, also where the run converges. On the NACA 4412 the computed maximum lift is 15% above the measured one and comes about 2 degrees late. Past maximum lift, the steady solution can even depend on how the computation got there.
Flows that do not settle. The Eppler E423 at a Reynolds number of 200,000 did not converge at 6, 8 and 10 degrees: the solution keeps moving between an attached and a separated state. Such points are not hidden. The report says that no steady solution was reached, and their numbers should not be used. An unsteady solver is the remedy, and it is in development.
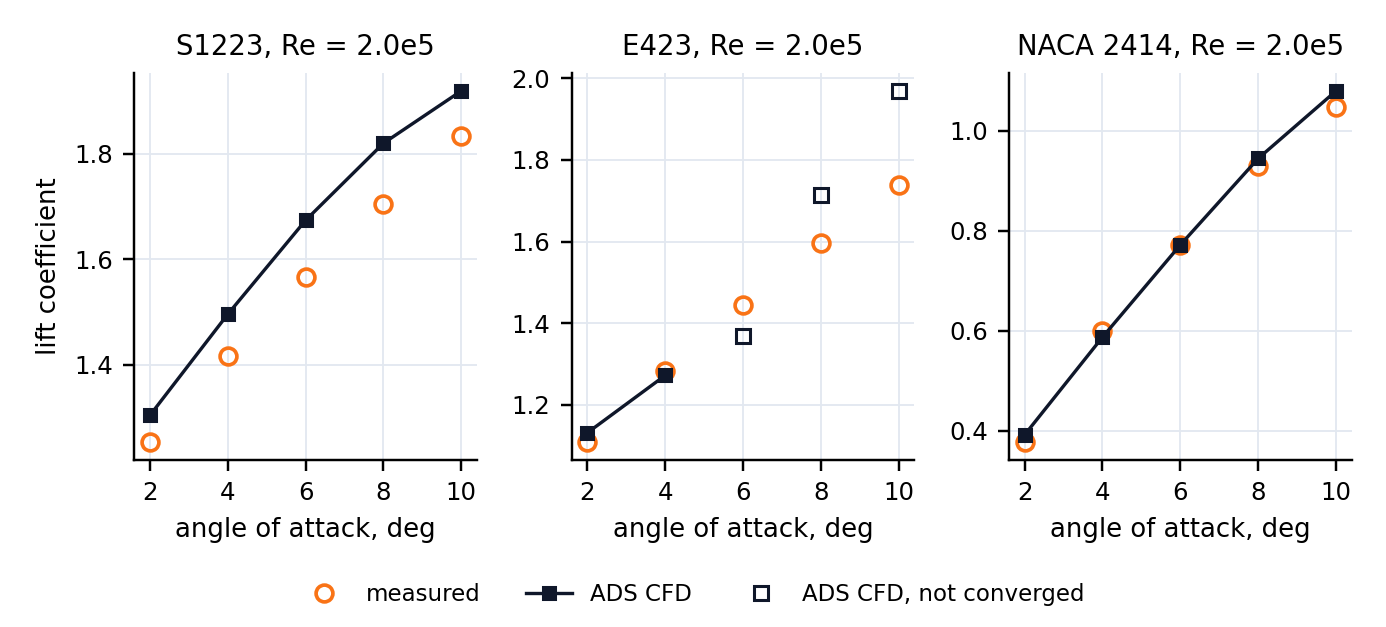
Low Reynolds numbers at higher angles. At a Reynolds number of 200,000, the result at 6 and 8 degrees depends on the grid by up to 6% in lift and 5% in drag, as much as it differs from the measurements.
What this means for your simulations
- Use the CFD tool for what a polar alone does not give you: the pressure and velocity fields, the extent of separated flow, and shapes outside the assumptions of a panel method, such as blunt trailing edges or Gurney flaps.
- Read the drag as that of a wing whose boundary layer is turbulent. That fits a wing on a car. For a smooth wing in clean air, compare with XFOIL.
- Check the convergence note of every point. A point without a steady solution is reported as such.
- Treat values near maximum lift as indicative.
- Results are two-dimensional. They do not include tip vortices or any other effect of a finite wing.
The app also lists two further modes, "RANS with transition" and "URANS (unsteady)". Both are locked for single-element airfoils for now. In steady computations the transition model did not give results that hold when the grid is refined, so we do not offer it, and nothing in this post applies to it. We will take it up again together with the unsteady solver.
The full note
ADS-TN-01, attached below, has every table and figure, the numerical uncertainty, the limits of the method and all references. It is a technical note, not a peer-reviewed paper: read it, check our numbers, and tell us where you disagree.
Sources and notice
Reference solutions: NASA Langley Turbulence Modeling Resource (Rumsey, Smith and Huang, AIAA Paper 2010-4742). Measurements: Somers, NREL/SR-440-6918 (S809); Abbott, von Doenhoff and Stivers, NACA Report 824 (NACA 4412); Selig and co-authors, Summary of Low-Speed Airfoil Data, Volumes 1 and 2 (S1223, E423, NACA 2414); McGhee and Beasley, NASA TN D-7428 (GA(W)-1); Sivier, Ormsbee and Awker, SAE Paper 740366 (UI-1720). The complete references are in the note.
Results are two-dimensional RANS estimates for education and early-stage design. They are not certified engineering data; see our Terms of Service. Measured data and reference solutions remain the work of their authors, and the figures in this post were made by ADS from those data. No affiliation with, or endorsement by, the University of Illinois, NASA, the National Renewable Energy Laboratory, Delft University of Technology, OpenCFD Limited or any other cited author or institution is stated or implied.