CFD Result · AoA Sweep
NACA_4412_example
Aerodynamic Coefficients
5 angle points
Lift coefficient Cl
−0.504
Drag coefficient Cd
0.0108
Lift / Drag
−46.7
Moment Cm (c/4)
0.112
Angle of attack
0°
Peak |Cl| −0.985 at AoA 6°
·
Peak |L/D| −70.9 at AoA 2°
peaks selected by absolute magnitude (orientation-agnostic)
3D Wing Estimates
Prandtl + Hoerner
Cl 3D
−0.337
Prandtl finite-span
Cd 3D
0.0166
section + induced
L/D 3D
−20.3
effective ratio
Downforce [N]
51
q·S·|Cl_3D| @ v=30.0m/s
Drag [N]
2.5
q·S·Cd_3D
Cdi
0.0076
e = 0.85 (Oswald)
AR geometric
4.40
b=1100mm / c=250mm
AR effective
5.55
+26.1% from endplate (H=151mm)
Endplate height h_ep = 151 mm (from project geometry)
AoA selection (3D estimates)
Velocity (force estimates)
30.0 m/s(108 km/h)
10 m/s30 m/s50 m/s
Reference: CFD ran at Re=500k (v=30.0 m/s). Cl/Cd treated as Re-independent, accuracy ±10% within ±50% of test Re.
Flow Field Visualizations
Independent AoA slider per field
Pressure field
Download this image
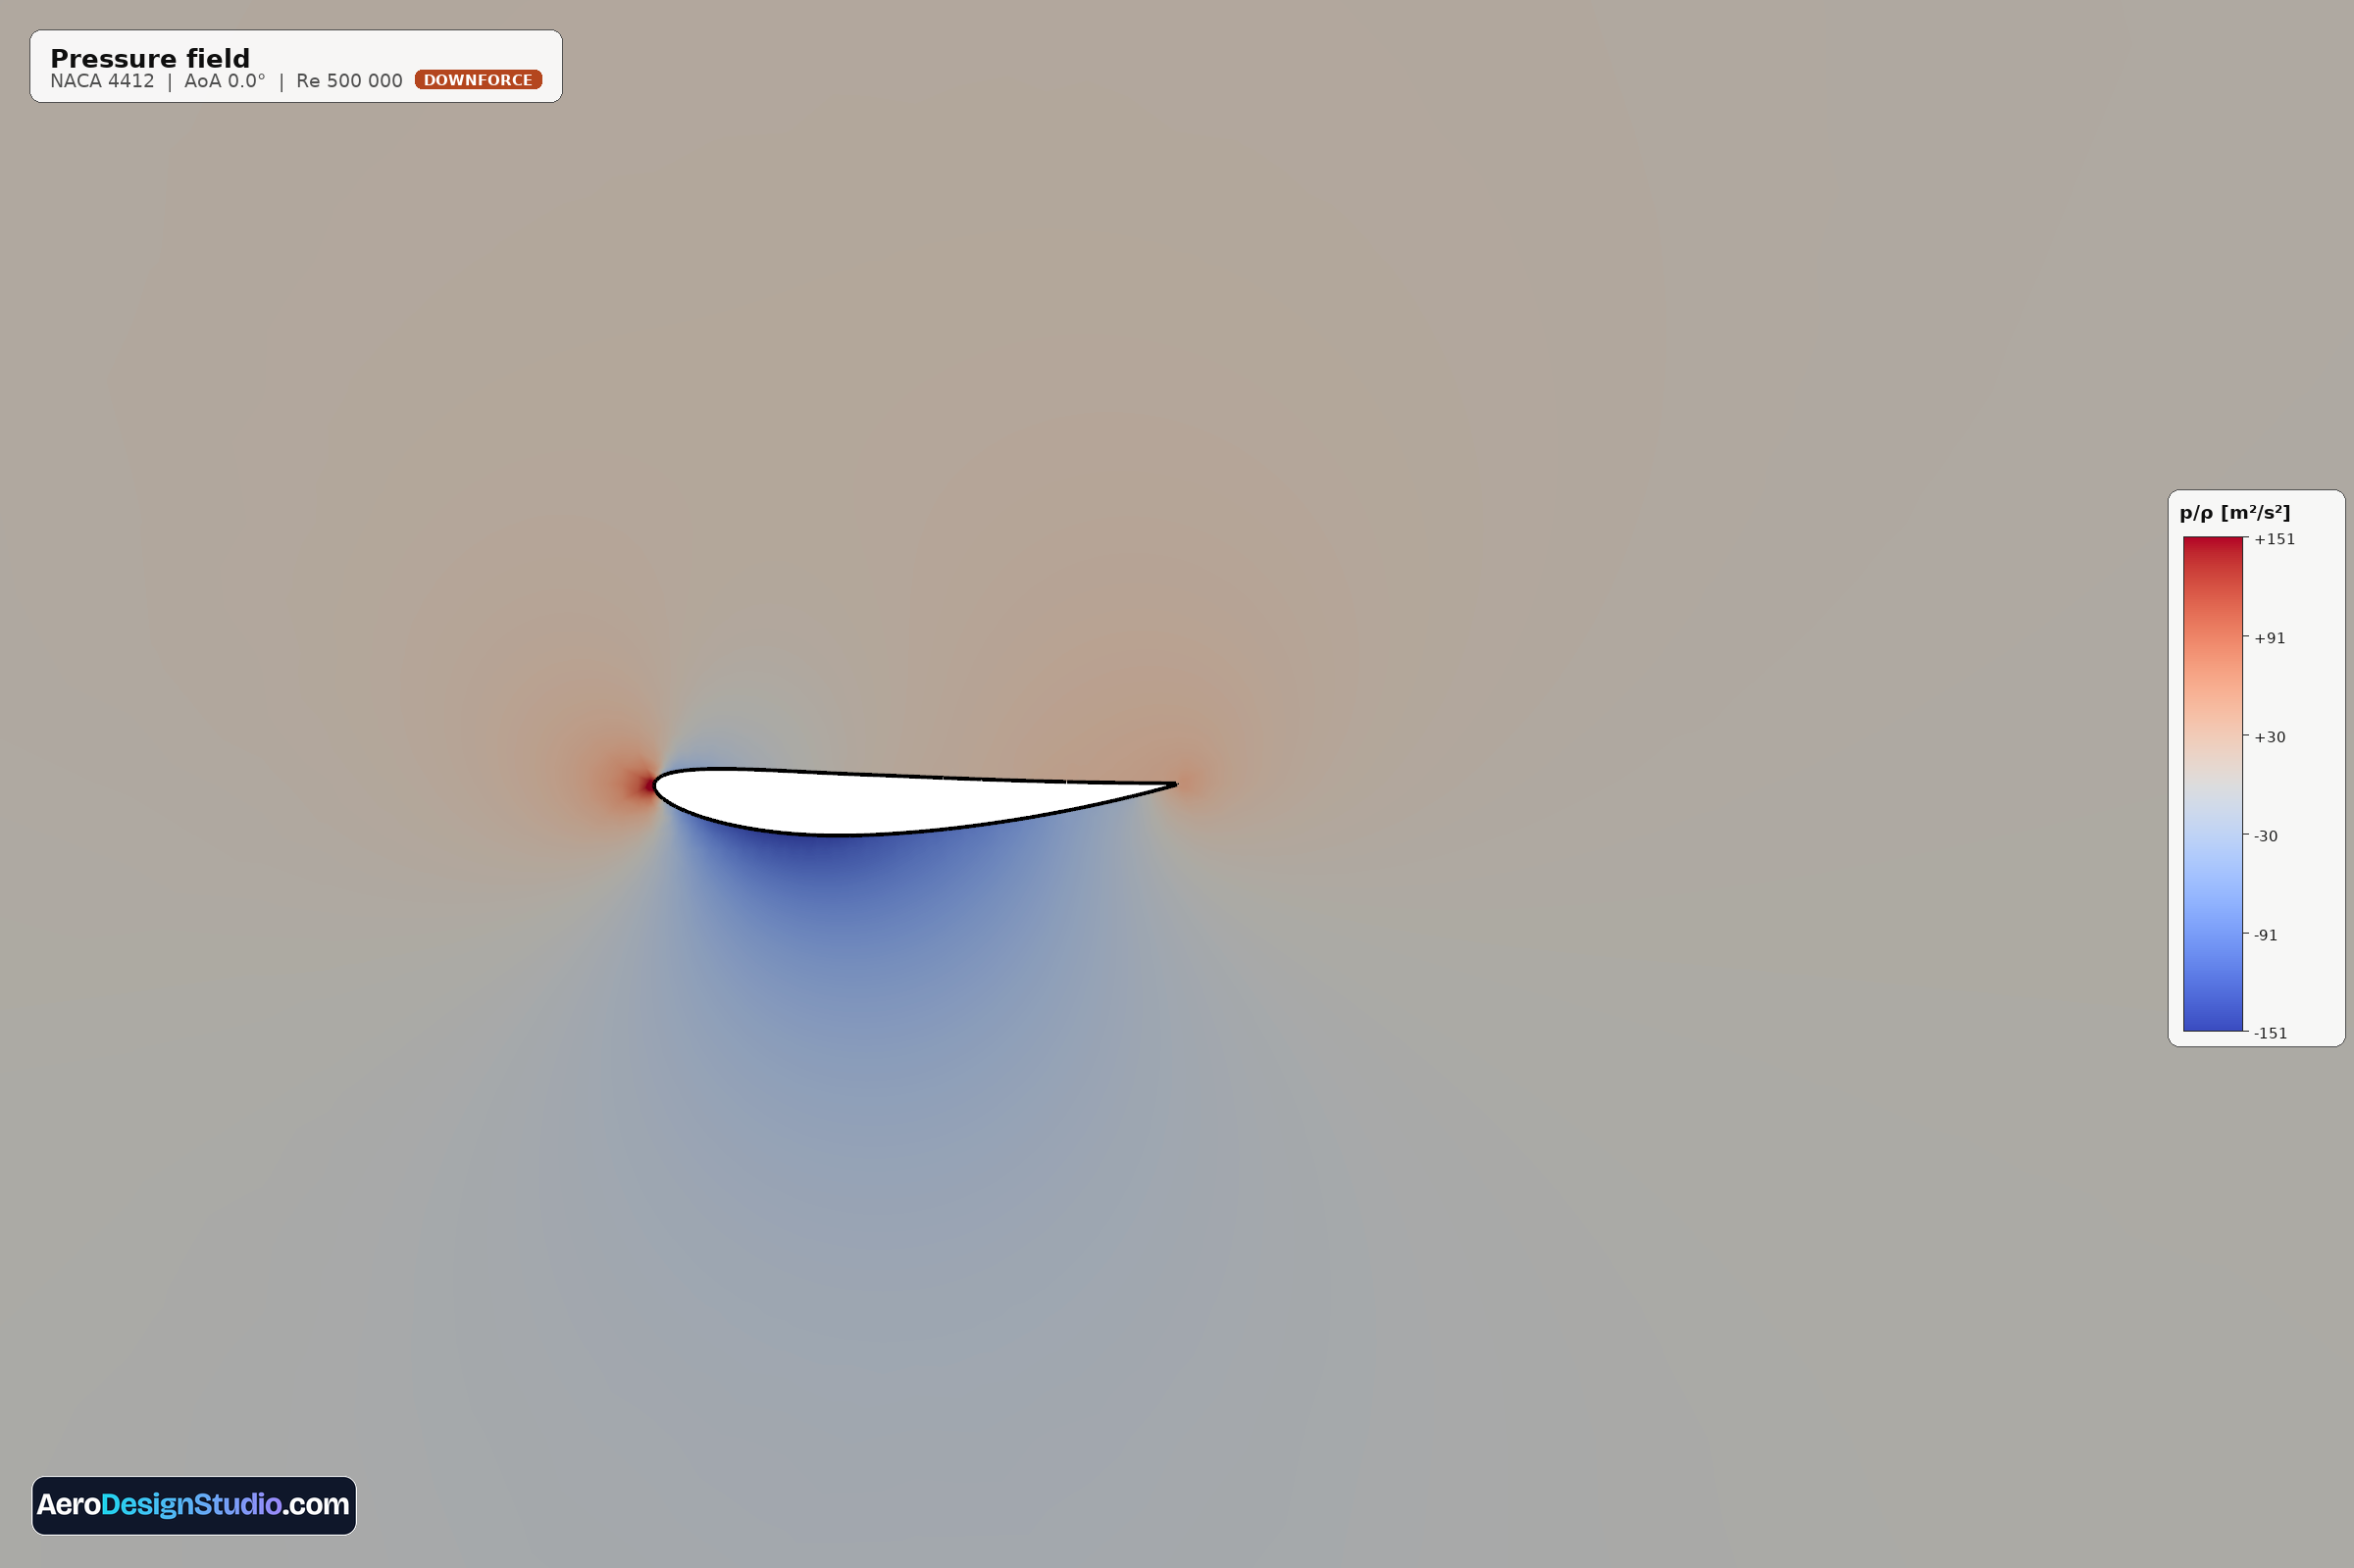
The kinematic pressure field shows how flow pressure varies around the airfoil. High pressure (red) builds up at the stagnation point and along the lower surface, while strong suction (blue) develops over the upper surface near the leading edge. The integrated pressure difference between upper and lower surfaces produces lift; the suction peak's depth and location reveal where the airfoil is working hardest.
Pressure coefficient (Cp)
Download this image
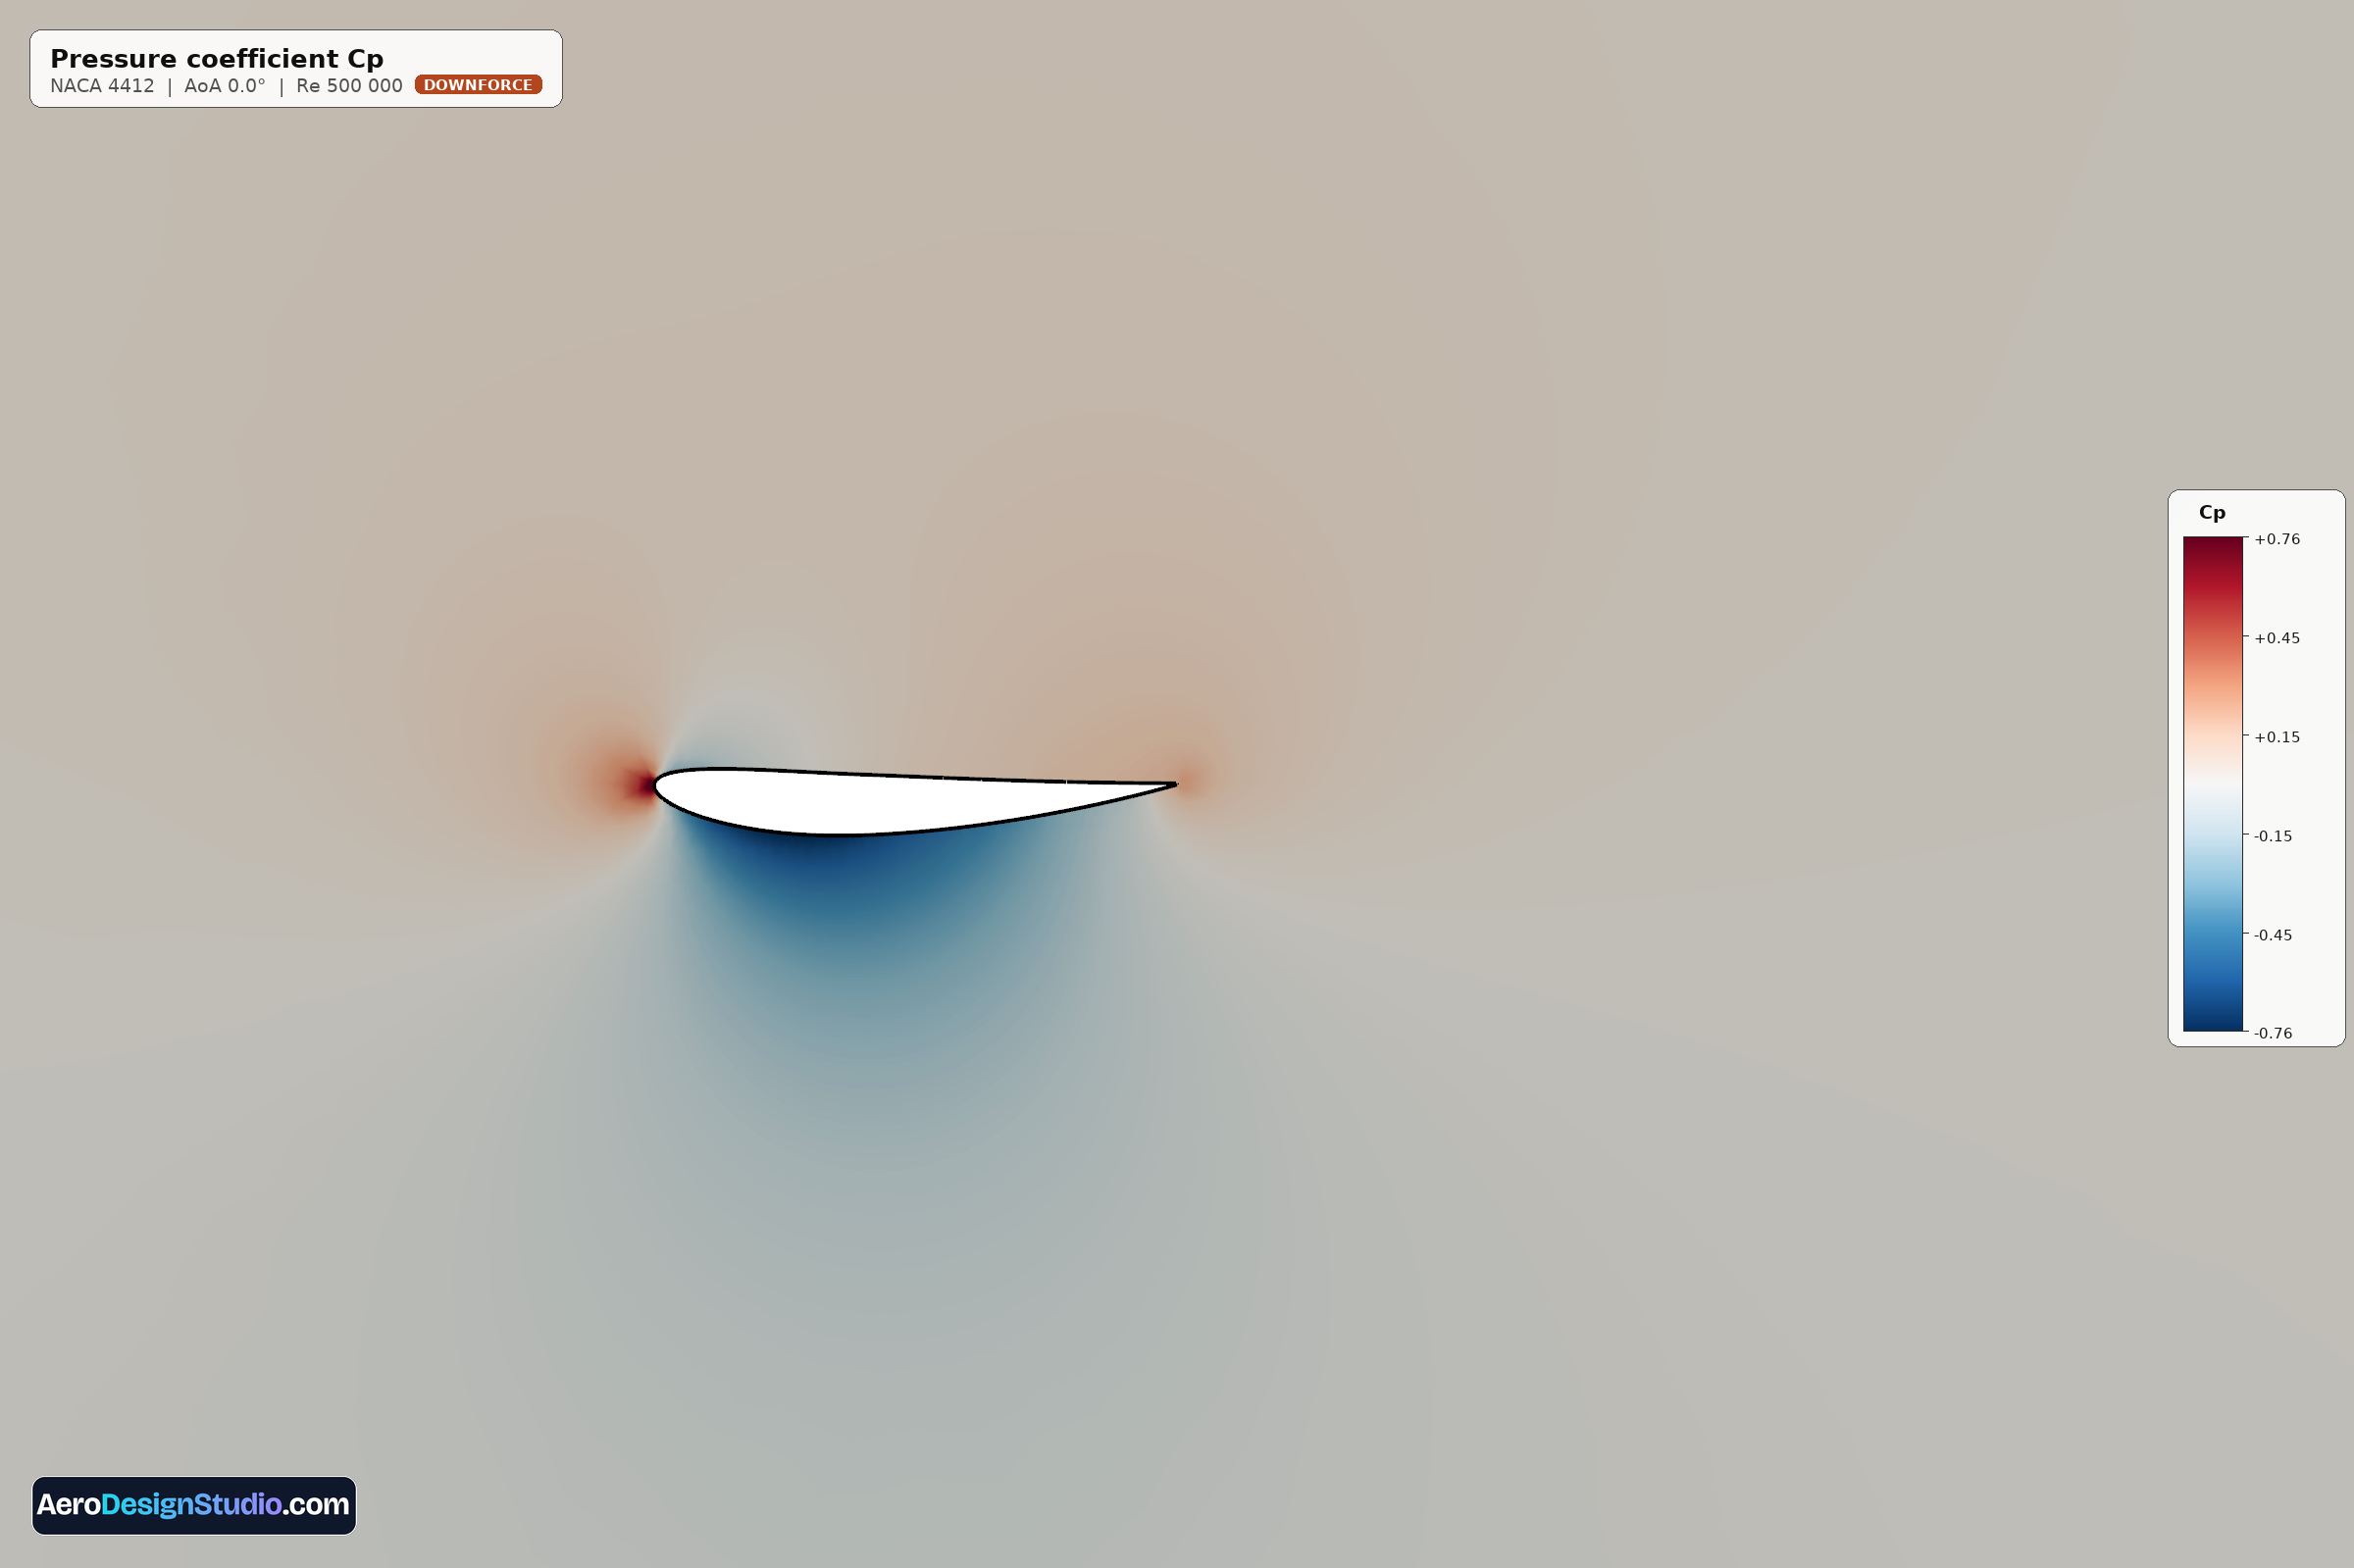
Pressure coefficient Cp is the non-dimensional pressure normalized by dynamic pressure (½ρU²). A value of +1 marks the stagnation point; negative Cp indicates suction. The line integral of Cp along the chord directly yields the lift coefficient Cl. Deep suction peaks near the leading edge signal aggressive loading and can predict stall onset.
Velocity magnitude |U|
Download this image
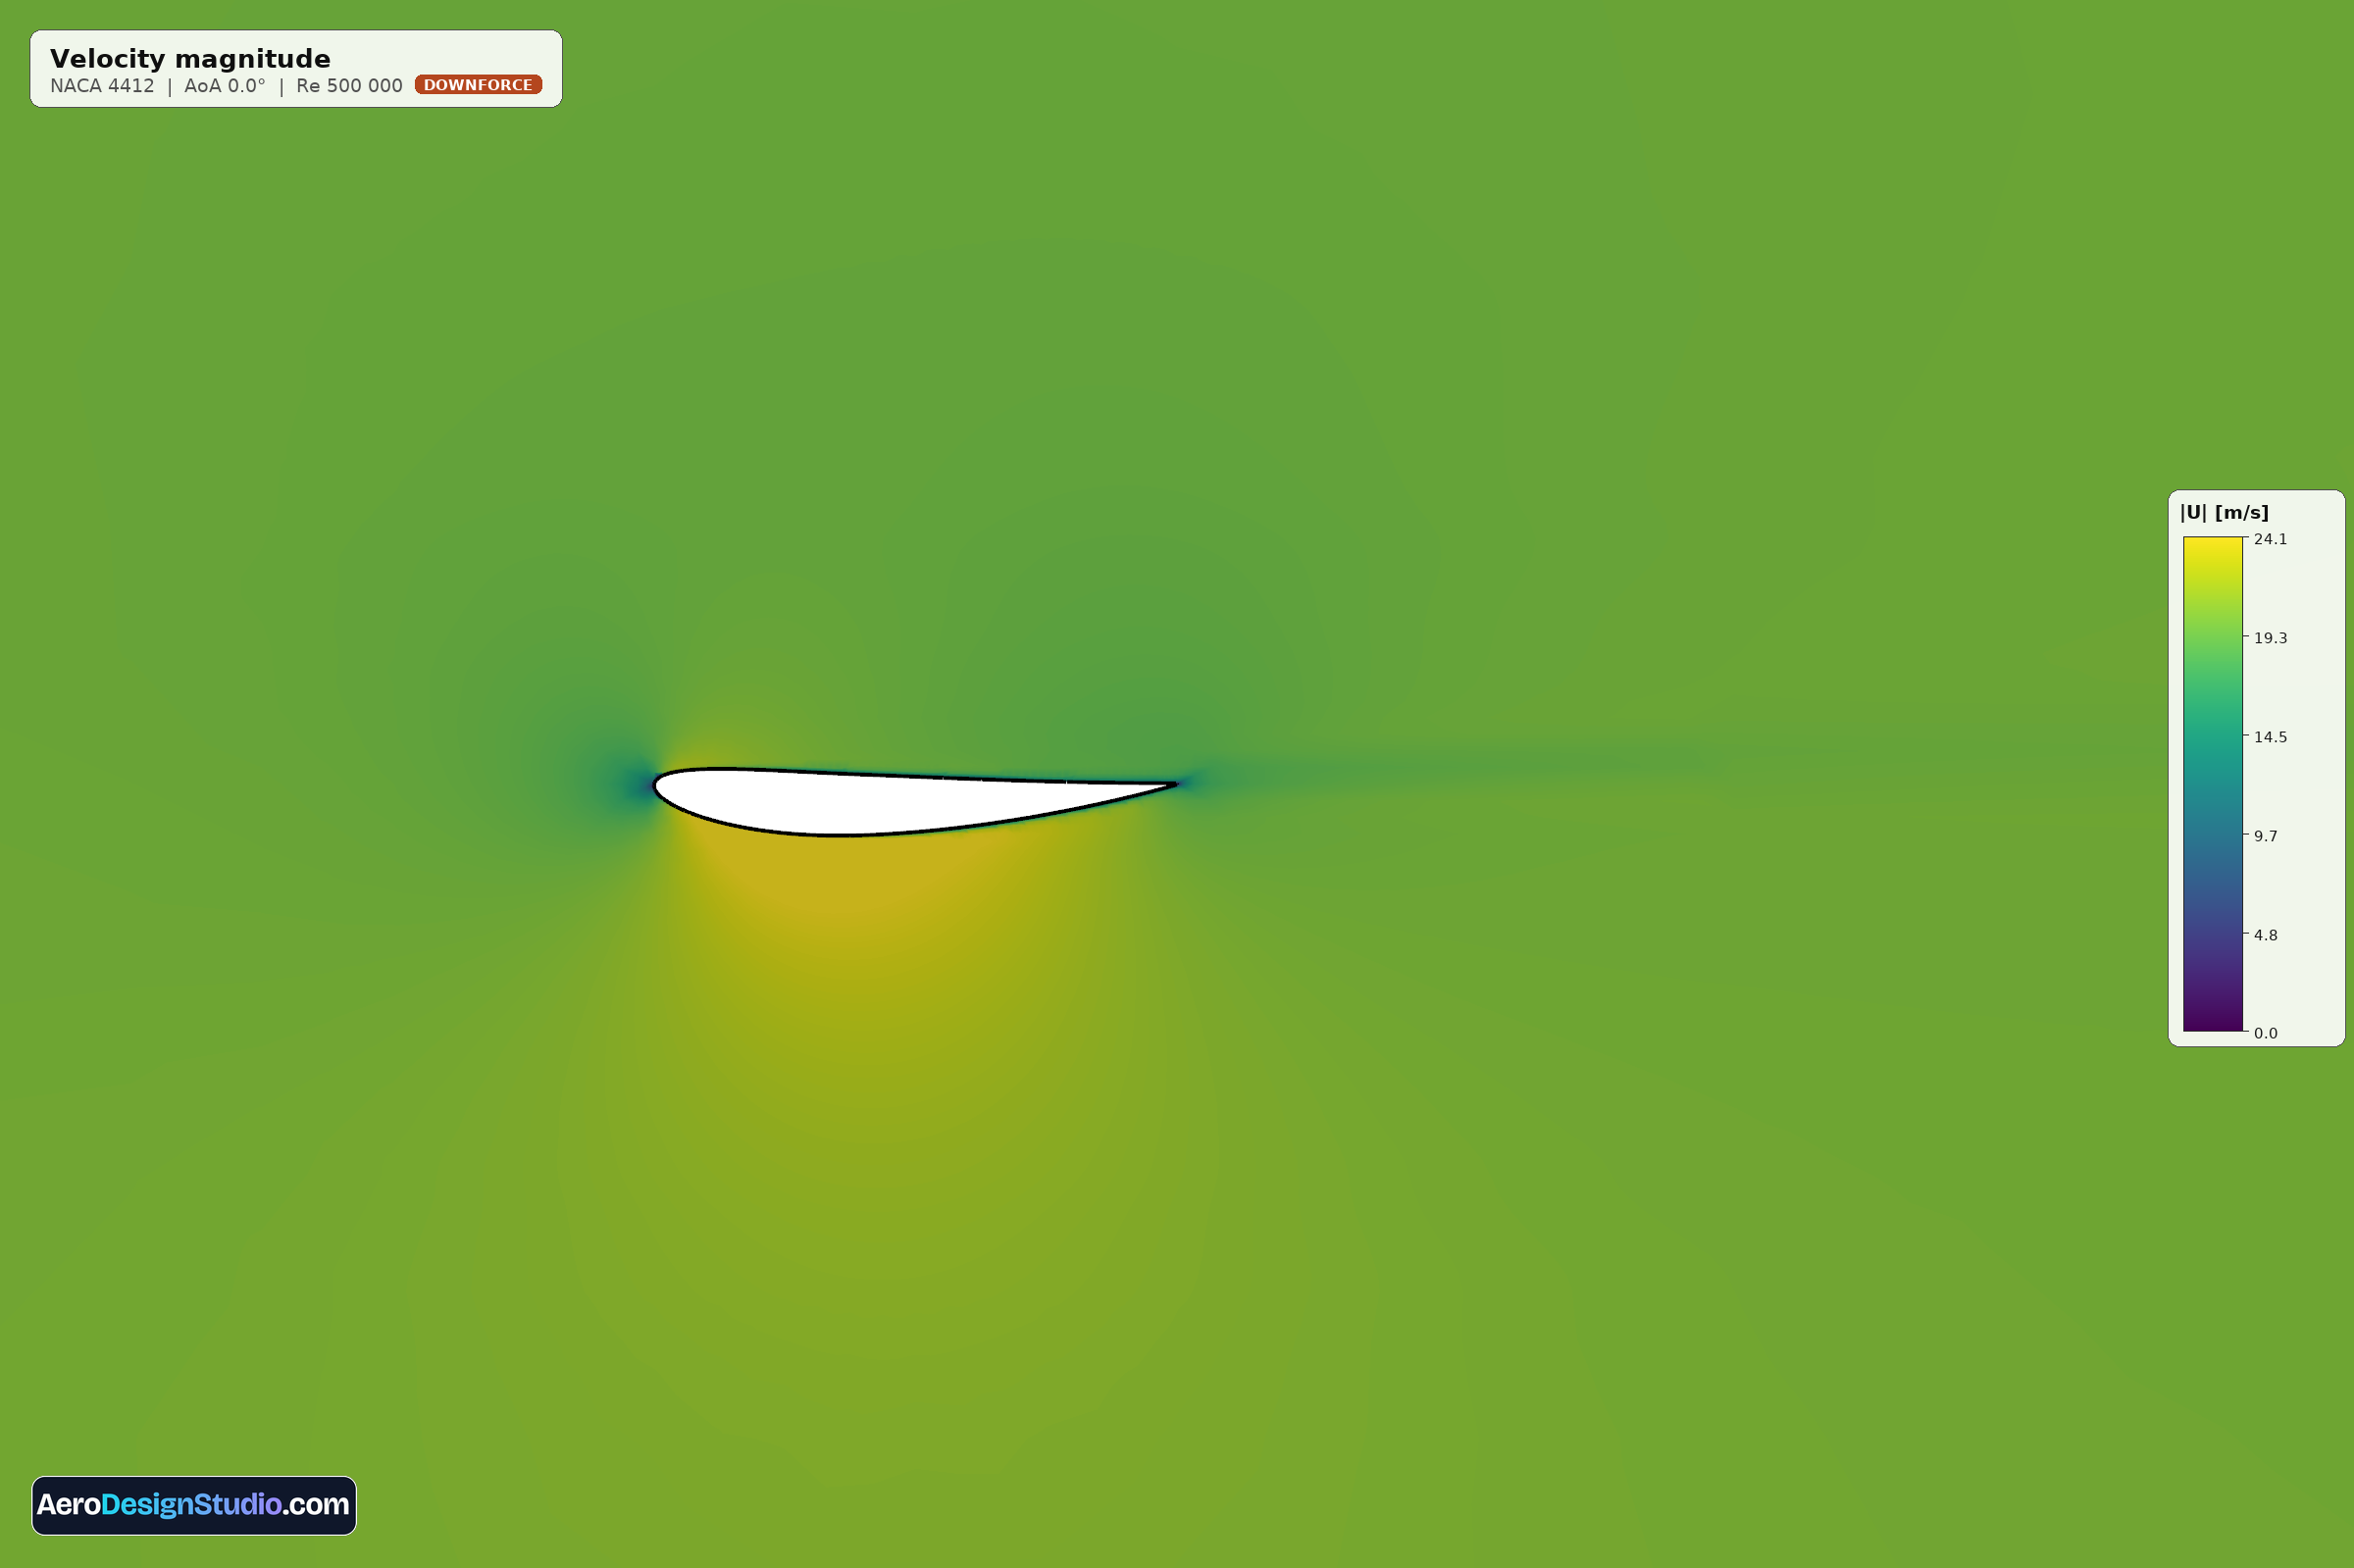
Velocity magnitude across the flow field. The darkest blue region near the leading edge marks the stagnation point where the flow comes to rest; the brightest yellow-green band above the airfoil is where flow accelerates to conserve mass. By Bernoulli's principle, the highest-speed regions correspond to the lowest pressure: these are the suction zones driving lift.
Streamlines
Download this image
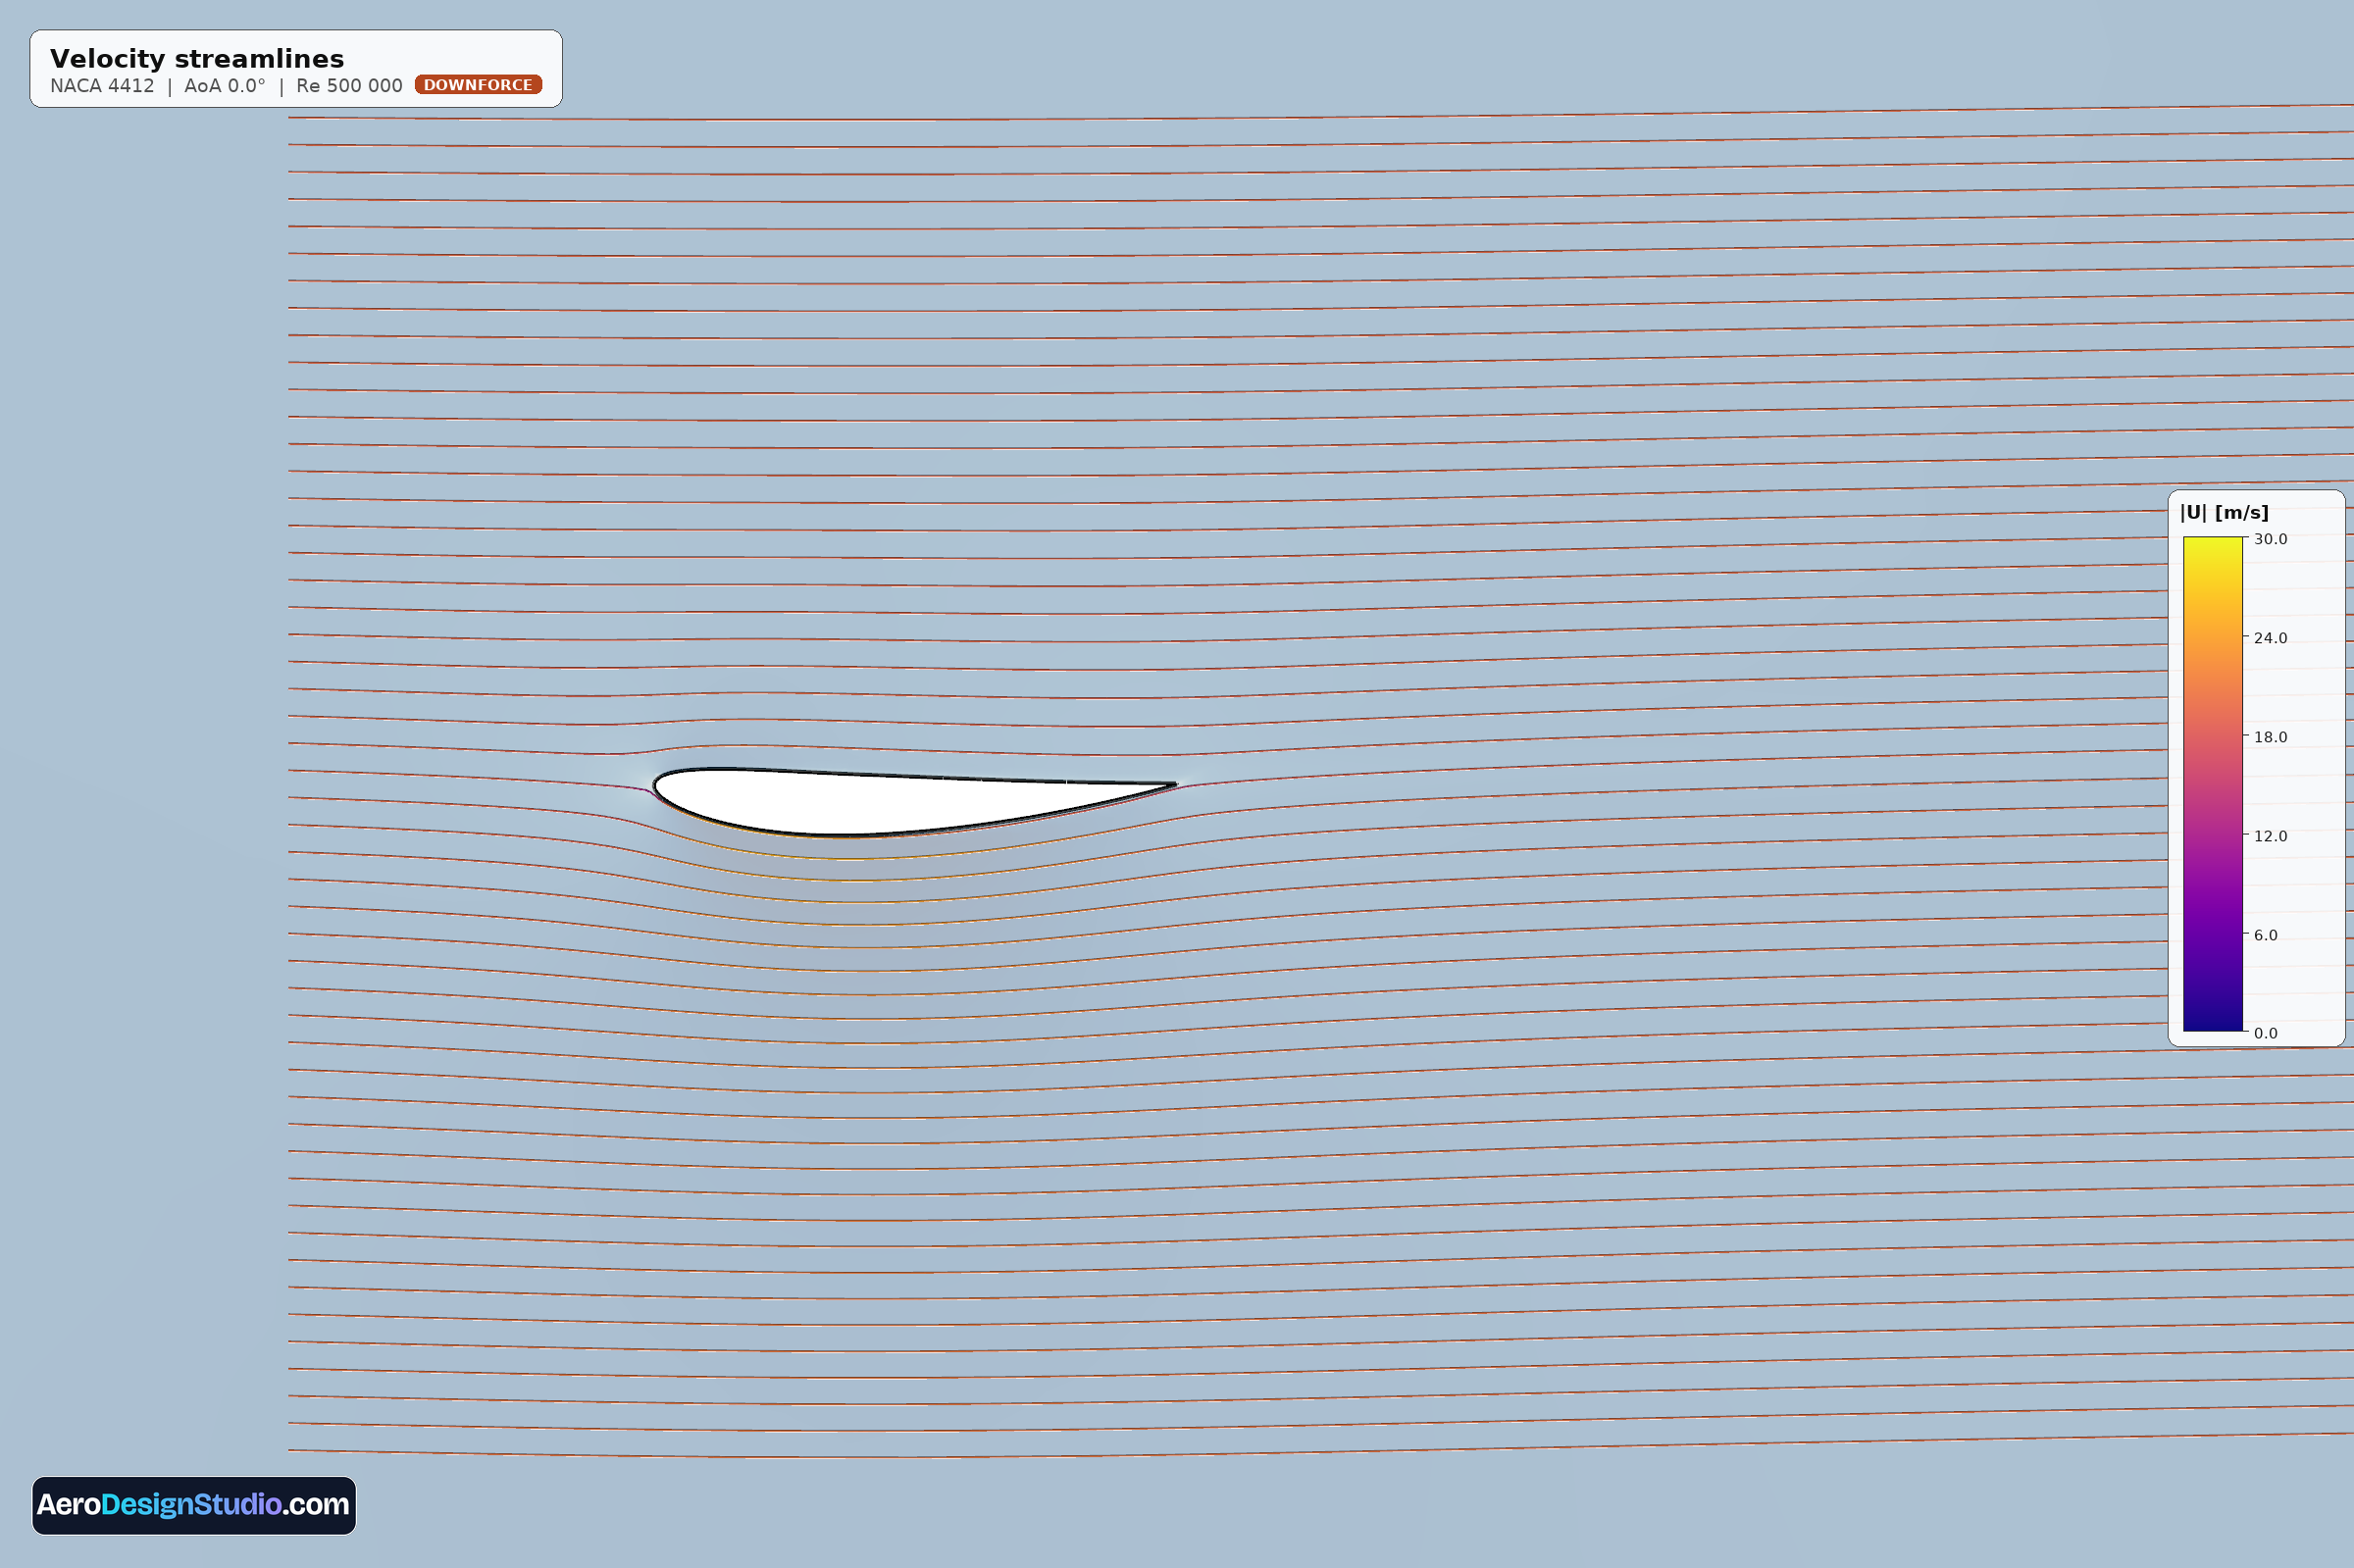
Imaginary paths traced by massless particles in the steady-state flow. They reveal how flow turns around the airfoil, where it accelerates, and any separation or wake structures aft of the trailing edge. Color encodes local speed. Clean parallel streamlines indicate attached, healthy flow; swirls or recirculation regions indicate separation and loss of lift.
This is what every simulation delivers
Design your rear wing in the browser, run a real OpenFOAM CFD sweep, and get this exact report: coefficients, 3D estimates and flow fields.
Open the wing designer